NEAR Price At $6 Base Offers A Buy The Dip Moment
Author: Sohrab Khawas 
Sohrab Khawas 
Author
Sohrab is a passionate cryptocurrency news writer with over five years of experience covering the industry. He keeps a keen interest in blockchain technology and its potential to revolutionize finance. Whether he's trading or writing, Sohrab always keeps his finger on the pulse of the crypto world, using his expertise to deliver informative and engaging articles that educate and inspire. When he's not analyzing the markets, Sohrab indulges in his hobbies of graphic design, minimal design or listening to his favorite hip-hop tunes.


Apr 5, 2024 14:38
Sohrab Khawas
Author
Sohrab is a passionate cryptocurrency news writer with over five years of experience covering the industry. He keeps a keen interest in blockchain technology and its potential to revolutionize finance. Whether he's trading or writing, Sohrab always keeps his finger on the pulse of the crypto world, using his expertise to deliver informative and engaging articles that educate and inspire. When he's not analyzing the markets, Sohrab indulges in his hobbies of graphic design, minimal design or listening to his favorite hip-hop tunes.

The formation of a bullish pennant pattern prepares the Near coin price for recovery beyond $9 high.
The current correction wavering above 50% Fibonacci retracement level indicates the buyers hold a dominant stand in this altcoin.
A confluence of several technical levels at $6 support creates a high demand zone for buyers.
The cryptocurrency market entered the 2024 quarter 2 with a surge in volatility following the Bitcoin price pullback below $70000. This reversal triggered a fresh wave of correction in the majority of major cryptocurrencies including Near Protocol (NEAR).
Since mid-March, the NEAR price has experienced a steady correction, falling from $9 to $6, which marks a 33% decrease. However, with pullback sustaining above 50% retracement level and developing a bullish chart pattern, indicating this asset is poised for further growth.
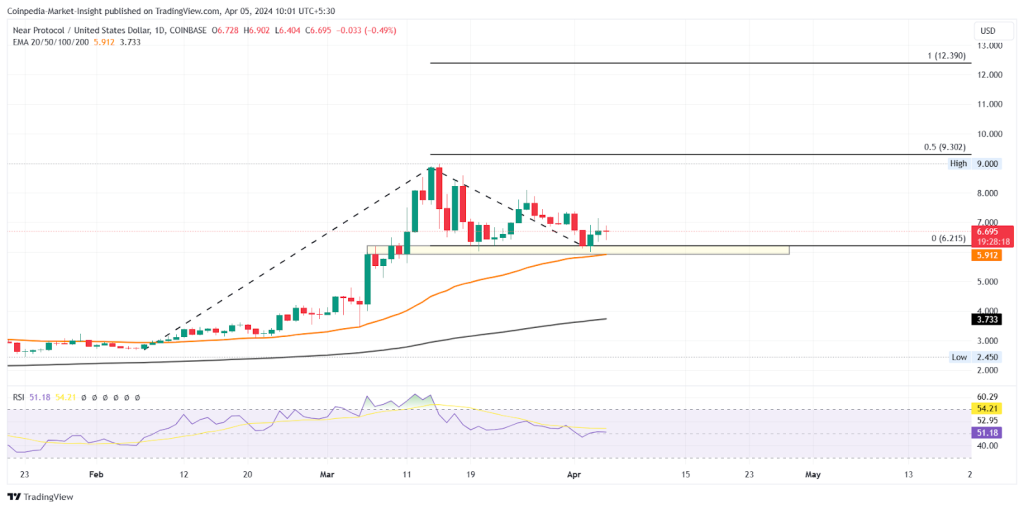
Amid the broader market correction, the NEAR coin price showcased a retracement to the $6 psychological level. This support coinciding with the 50-day EMA and above 50% FIB level creates a high area of interest(AOI) for buyers.
On April 3rd, the altcoin witnessed its second reversal from $6 leading to a 13% upswing to reach $6.7. Currently, the Near protocol holds a market cap of $7.146 Billion, with a trading volume of $548.1 Million.
Furthermore, an analysis daily chart reveals the formation of a bullish pennant pattern as the current correction strictly resonates within two converging trendlines after the aggressive rally.
Source: Tradingview
The pennant chart pattern is commonly observed in an established uptrend as the price tends to consolidation/correct for a brief period to regain its exhausted momentum.
Also Read : Massive Rally On Horizon For These Major Altcoins
Technical indicators:
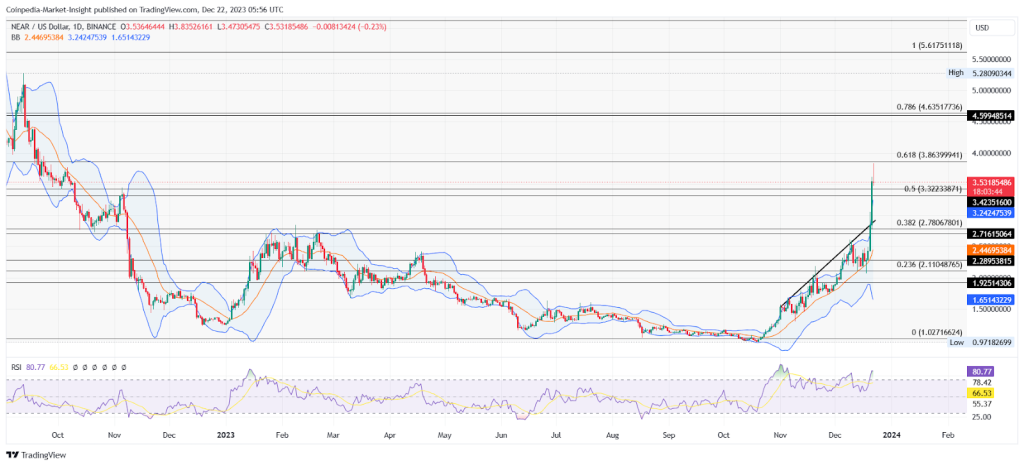
Bollinger Bands: The NEAR price challenging the upper boundary of Bollinger band indicator projects the buyers are aggressively accumulating this asset.
EMA: The 50-day EMA slope acts as a dynamic support for NEAR price during market pullbacks. Moreover, an uptick indicates the short rally align with broader bullish trend
Will NEAR Price Correction Reach $5?
With an intraday gain of 0.68%, the NEAR coin price is gradually leading to the upper boundary of the pennant pattern. Should a breakout occur, the buyers will gain a suitable launchpad to prolong the prevailing recovery trendline.
The post-breakout rally may drive the NEAR price to $10 milestone, followed by an ambitious target of $12.5.
On the flip side, a breakdown below the $6 support could extend correction to $5.1.
Also Check Out The : Ethereum Classic Hints A Bearish Pattern! ETC Price To Drop 10% Soon?