

Bitcoin (BTC) reached a new all-time high price of $64,854 on April 14, but decreased almost immediately afterwards.
Despite the drop, bitcoin validated the previous breakout level and has now begun to move upwards. It’s currently increasing towards the closest resistance at $68,725.
New bitcoin all-time high
After breaking out from the $61,500 resistance area on April 13, BTC proceeded to reach a new all-time high price of $64,854 on April 14.
However, it dropped to a low of $61,301 the same day. This validated the $61,500 area as support and created a low longer wick. The price has been moving upwards since.
Technical indicators are bullish, supporting the continuation of the upward movement. Both the RSI and Stochastic Oscillator are increasing. Furthermore, the MACD is very close to turning positive. These are all common signs of a bullish trend.
The next resistance area will likely be found at $68,724.

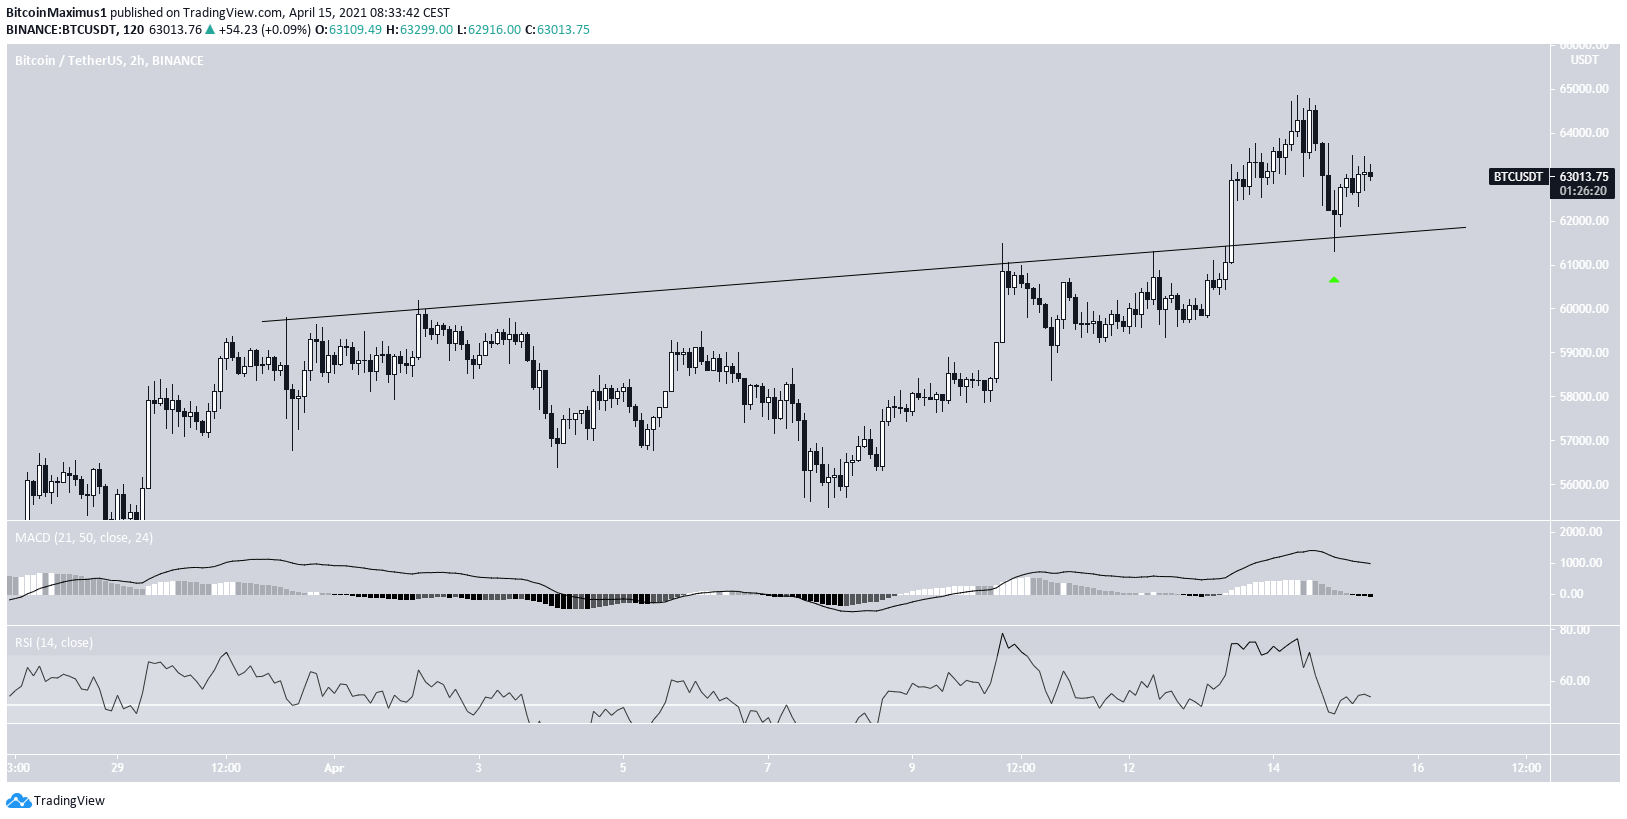
Short-term movement
A look at the two-hour chart shows that yesterday’s drop served to validate the previous ascending resistance line as support.
After touching the line (green arrow), BTC began the current bounce, which is still ongoing.
Despite the MACD not giving a bullish reversal sign, it’s still positive. Furthermore, the RSI has moved back above 50.
As a result, the price is expected to gradually move upwards towards the previously outlined resistance area.
BTC wave count
The wave count suggests that BTC is in sub-wave five (orange) of a longer-term bullish impulse. The entire upward move has a target between $83,000-$90,500. This is found using an external Fib retracement and a Fib projection.
A closer look shows that it’s in minor sub-wave three (black). The shortest-term count is shown in red.
Afterwards, a correction would be expected.

Conclusion
Bitcoin is expected to continue increasing towards the $68,425 level. If it can break through, BTC could reach a long-term top between $83,000-$90,500.
For BeInCrypto’s previous bitcoin (BTC) analysis, click here.
Trusted
Disclaimer
In line with the Trust Project guidelines, this price analysis article is for informational purposes only and should not be considered financial or investment advice. BeInCrypto is committed to accurate, unbiased reporting, but market conditions are subject to change without notice. Always conduct your own research and consult with a professional before making any financial decisions. Please note that our Terms and Conditions, Privacy Policy, and Disclaimers have been updated.
