

BTCD has been decreasing since December 2020 and has reached a long-term support level at 53%.
While BTCD has bounced and shown some bullish reversal signs, it has yet to confirm a bullish reversal.
Long-term BTCD movement
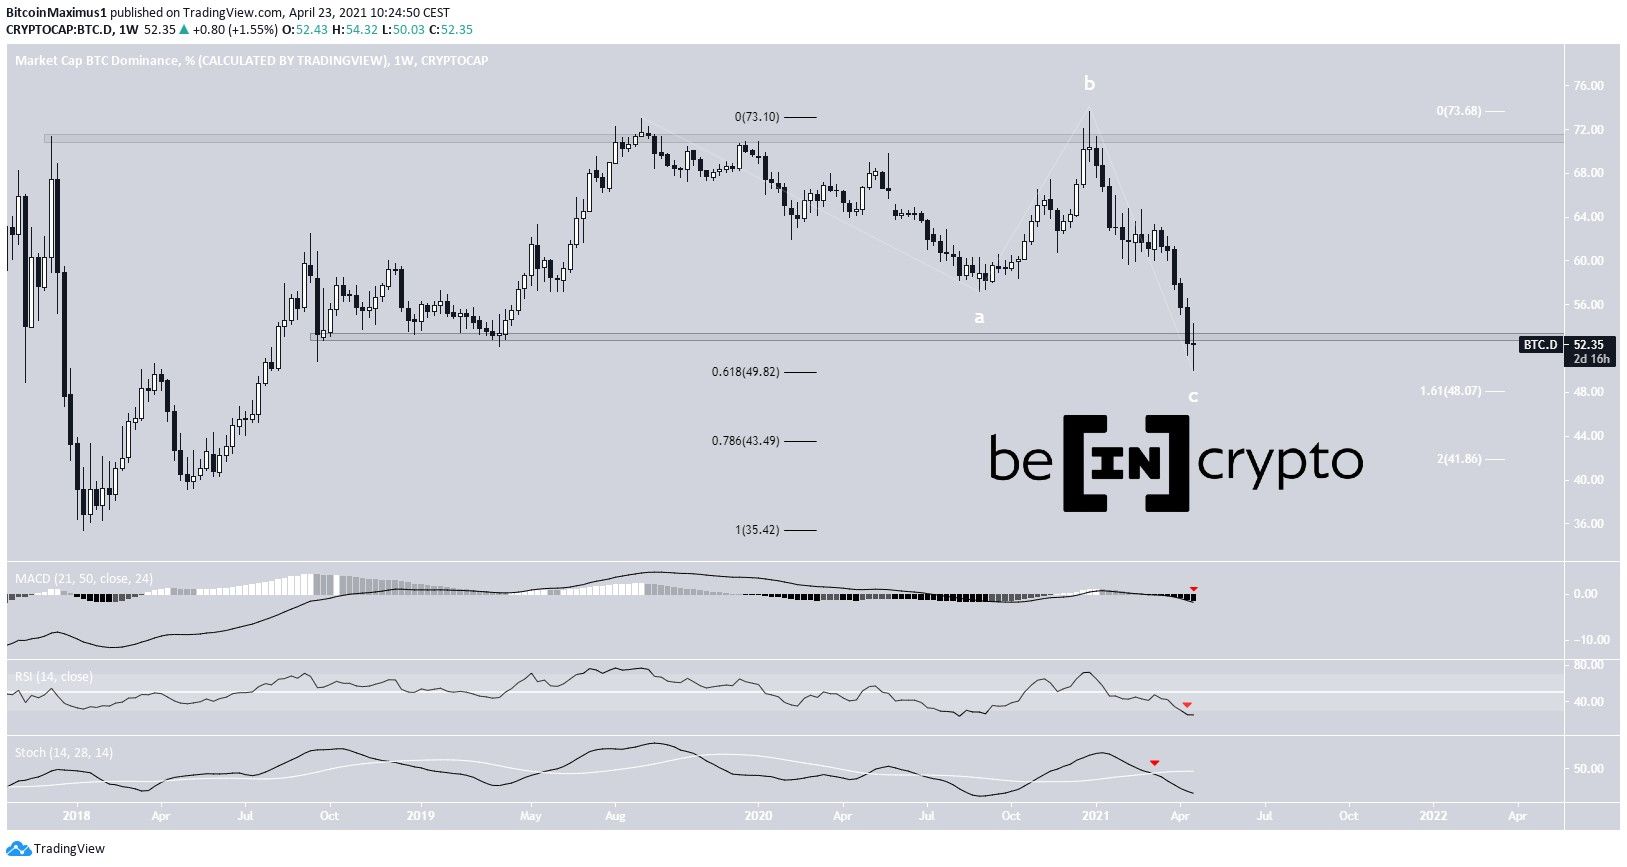
BTCD has been moving downwards since it reached a high of 71.30% on December 2020. The decrease was especially swift at the beginning of March.
So far, BTCD has reached a low of 50.3%, doing so on April 22.
The low was made right at the 0.618 Fib retracement support level when measuring the entire previous upward movement.
However, the closest horizontal support level is found at 53%. It is not yet clear if BTCD will reclaim this level or validate it as resistance.
If the latter occurs, the next support would be found at 43.50%, the 0.786 Fib retracement support level.
Long-term technical indicators are still bearish. The MACD has crossed into negative territory. The Stochastic Oscillator has made a bearish cross. Finally, the RSI has decreased below 30.
In addition, the current decrease could very well be a flat A-B-C structure. If waves A: C have a 1:1.61 ratio, it would indicate a bottom at 48%. If they have a 1:2 ratio, it will provide a bottom of 41.86%. Both these values are in alignment with the long-term fib support levels.
Short-term BTCD movement
Cryptocurrency trader @Damskotrades outlined a BTCD cart, stating that he expected a bounce before potential downwards continuation.
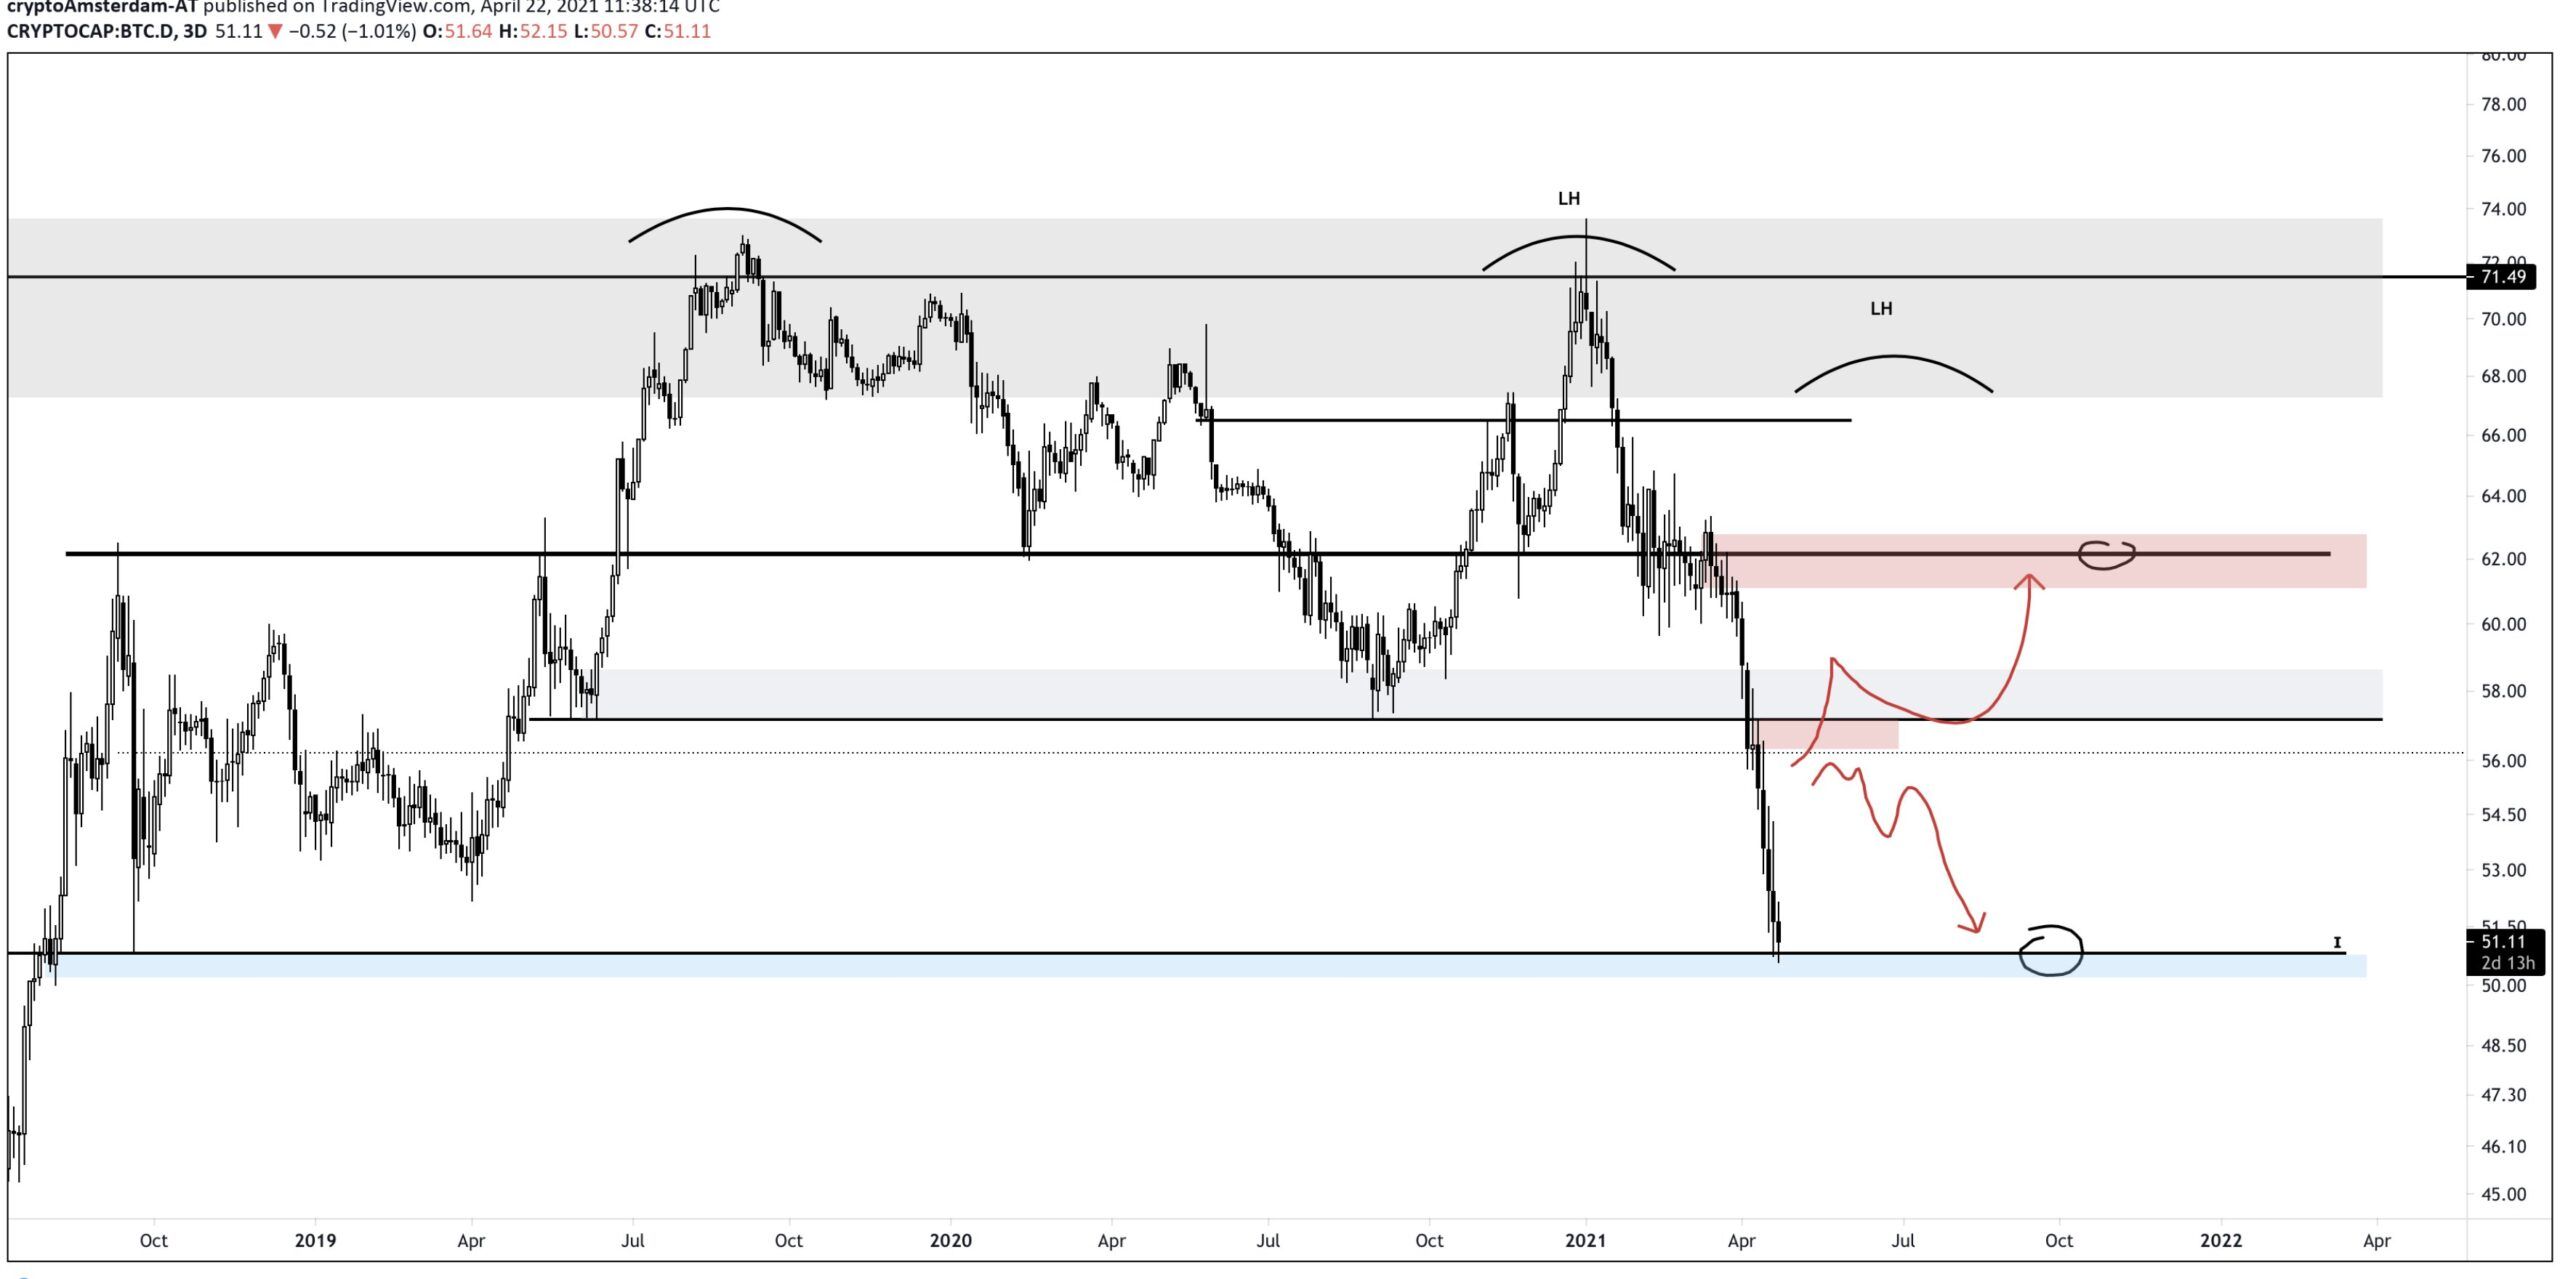
The daily chart has begun to show some bullish reversal signs. There is bullish divergence in the RSI, and the MACD has generated one higher momentum bar. Also, the Stochastic RSI is close to making a bullish cross.
However, neither of these signs are confirmed.
Furthermore, the 1.61 Fib projection of the drop provides a target of 42%, aligning with those given previously.
Therefore, unless BTCD manages to reclaim the 53% area, we could see a drop towards the 42-44% level.

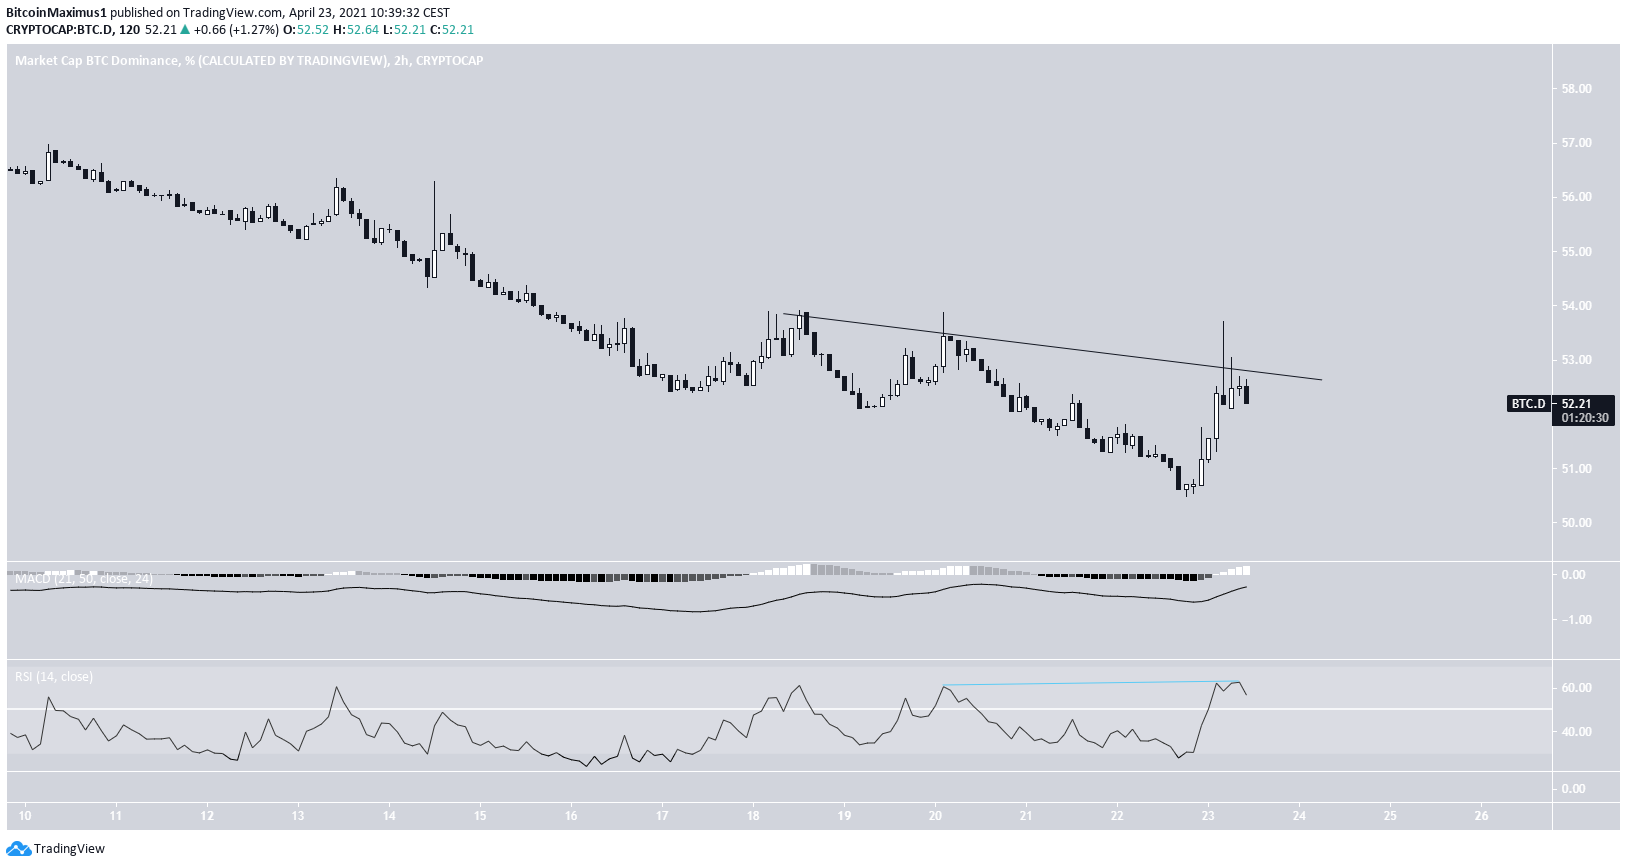
Finally, the short-term two-hour chart shows a descending resistance line, which has rejected BTCD.
In addition, the RSI has generated hidden bullish divergence.
Finally, the MACD signal line is below 0.
Therefore, it is more likely that this is just a short-term bounce and the long-term trend is still bearish.
Conclusion
To conclude, BTCD has reached a long-term support area and shown some signs of potentially beginning a bounce. However, it has yet to confirm it and the long-term trend still seems to be bearish.
For BeInCrypto’s latest bitcoin (BTC) analysis, click here.
Trusted
Disclaimer
In line with the Trust Project guidelines, this price analysis article is for informational purposes only and should not be considered financial or investment advice. BeInCrypto is committed to accurate, unbiased reporting, but market conditions are subject to change without notice. Always conduct your own research and consult with a professional before making any financial decisions. Please note that our Terms and Conditions, Privacy Policy, and Disclaimers have been updated.
