

The Bitcoin (BTC) price resumed its upward movement on April 28 but failed to reclaim resistance at $55,850.
Bitcoin is expected to find short-term support near $52,370 or $51,350. Afterward, it’s likely to make another breakout attempt above the $55,850 resistance area.
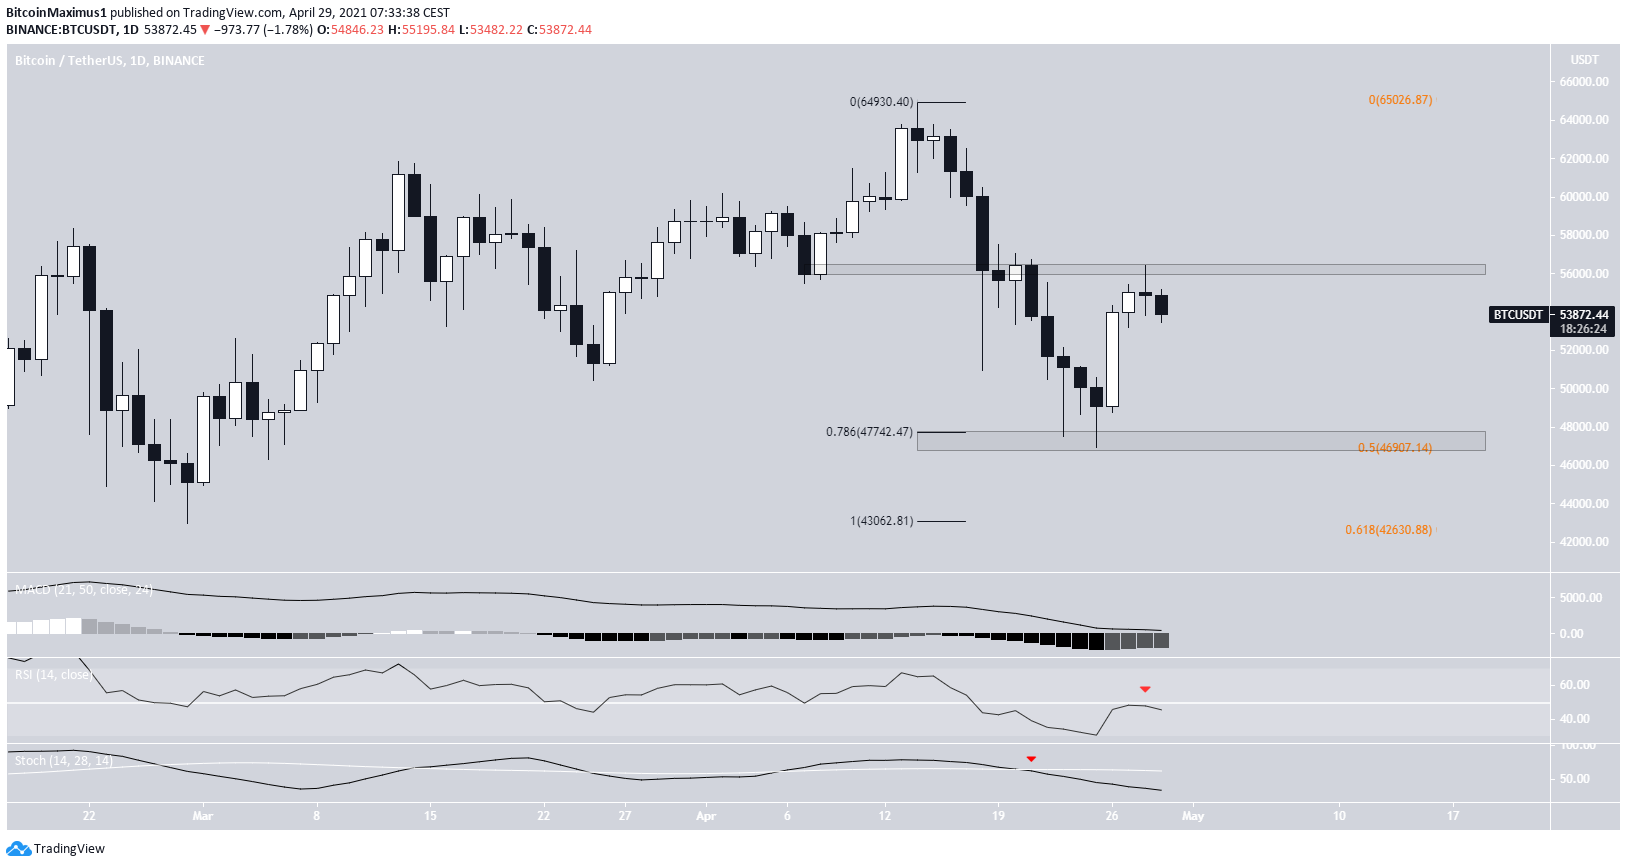
BTC resumes bounce
BTC has been increasing since bouncing on April 26. The bounce began at a strong support level between $46,900-$47,725. The support is created by the 0.5 long-term Fib (orange) and 0.786 short-term Fib (black) retracement levels.
However, BTC reached a high of $56,428 before decreasing.
While the MACD has given a bullish reversal signal, both the Stochastic Oscillator and the RSI are bearish. More specifically, the latter was just rejected by the 50-line and is now decreasing.
Until the price manages to reclaim the current resistance area near $56,000, we cannot consider the trend bullish.
Short-term BTC rejection
The two-hour chart shows that the rejection occurred from the 0.5 Fib retracement resistance area (black) at $55,865. This created a long upper wick and began the current downward movement.
The drop was preceded by bearish divergence in the RSI. In addition, the MACD has nearly turned negative while the RSI has already fallen below the 50-line. Both of these are considered bearish signs.
There are three minor support levels below the current price, created by the 0.382, 0.5, and 0.618 Fib retracement levels (white). These are found at $52,381, $51,349, and $50,317 respectively. The $51,329 level is also a horizontal support area and is expected to provide strong support if the price drops to it.

Conclusion
The rejection from the $55,850 area fails to confirm that the BTC trend is bullish. Similarly, technical indicators in the daily time frame are undecided.
BTC is expected to continue correcting in the short term until it reaches one of the support levels outlined.
For BeInCrypto’s previous bitcoin (BTC) analysis, click here.
Trusted
Disclaimer
In line with the Trust Project guidelines, this price analysis article is for informational purposes only and should not be considered financial or investment advice. BeInCrypto is committed to accurate, unbiased reporting, but market conditions are subject to change without notice. Always conduct your own research and consult with a professional before making any financial decisions. Please note that our Terms and Conditions, Privacy Policy, and Disclaimers have been updated.
