

Bitcoin (BTC) increased slightly during the week of Sept 13-20. It opened at $46,025 and reached a close of $47,241.
However, it has lost the $47,000 minor support area since then and seems to be in wave C of a corrective structure.
Long-term BTC movement
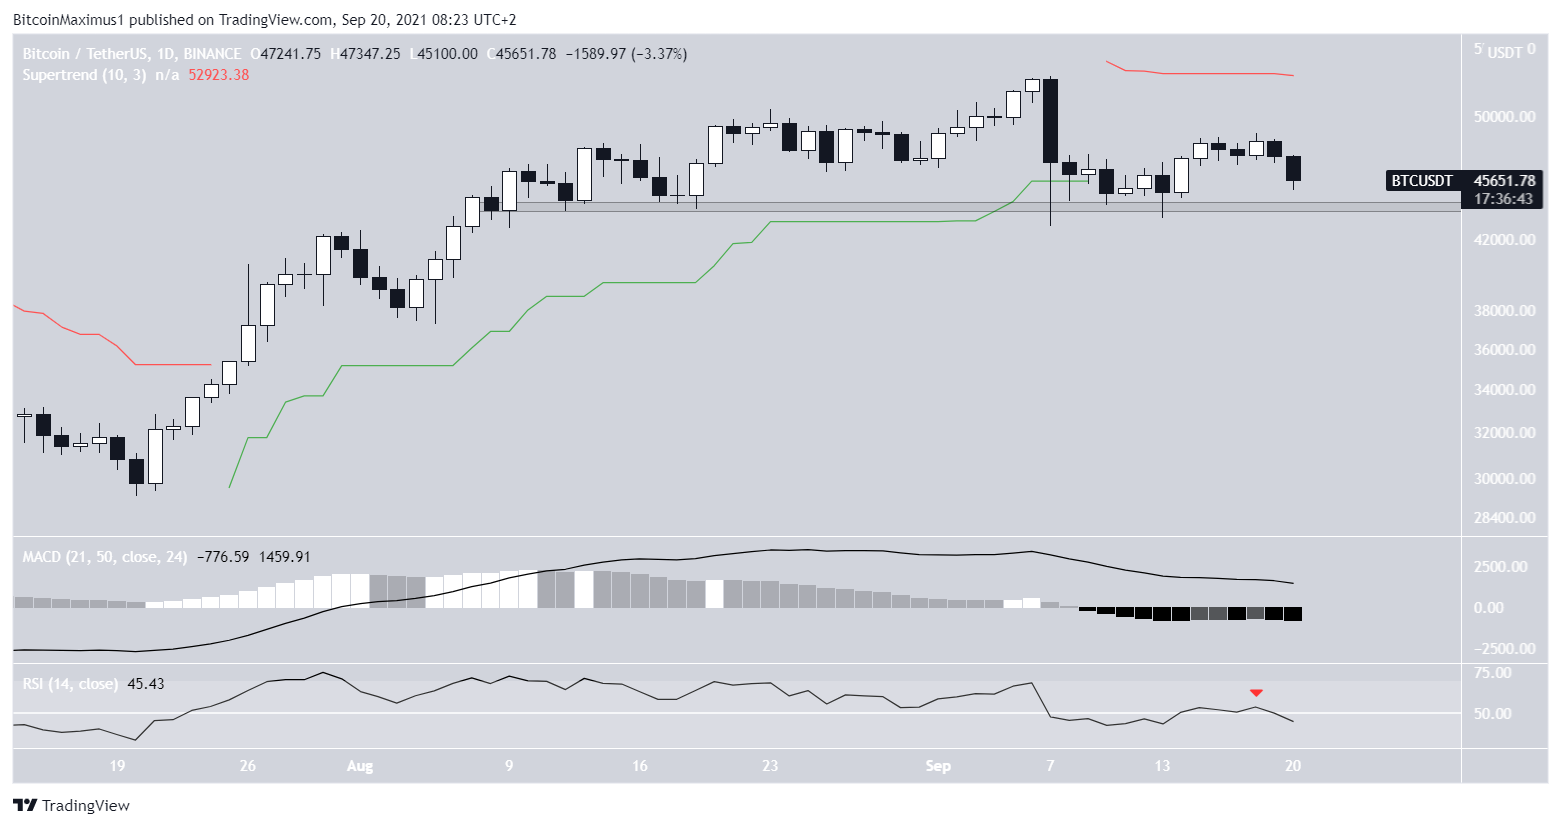
BTC increased slightly last week, creating a small bullish candlestick.
However, the weekly chart readings are still leaning on bearish. This is mostly because of the breakdown from the long-term ascending support line and its subsequent validation as resistance (red icon). This also coincided with a rejection from the bearish Supertrend line.
However, the MACD and RSI are both providing some bullish signals. The MACD is positive and its histogram has given a bullish reversal signal. The RSI has also just moved above 50.
Therefore, even though the long-term trend is leaning bearish, a look at lower time-frames is required in order to more accurately determine the direction of the trend.

BTC loses support
The daily chart also provides a bearish outlook. While BTC is still trading above the $44,000 horizontal support area, technical indicators are firmly bearish.
The RSI has fallen back below 50 after initially deviating above the line. Also, the MACD is decreasing and has nearly reached the negative territory. The weekly Supertrend line is bearish.
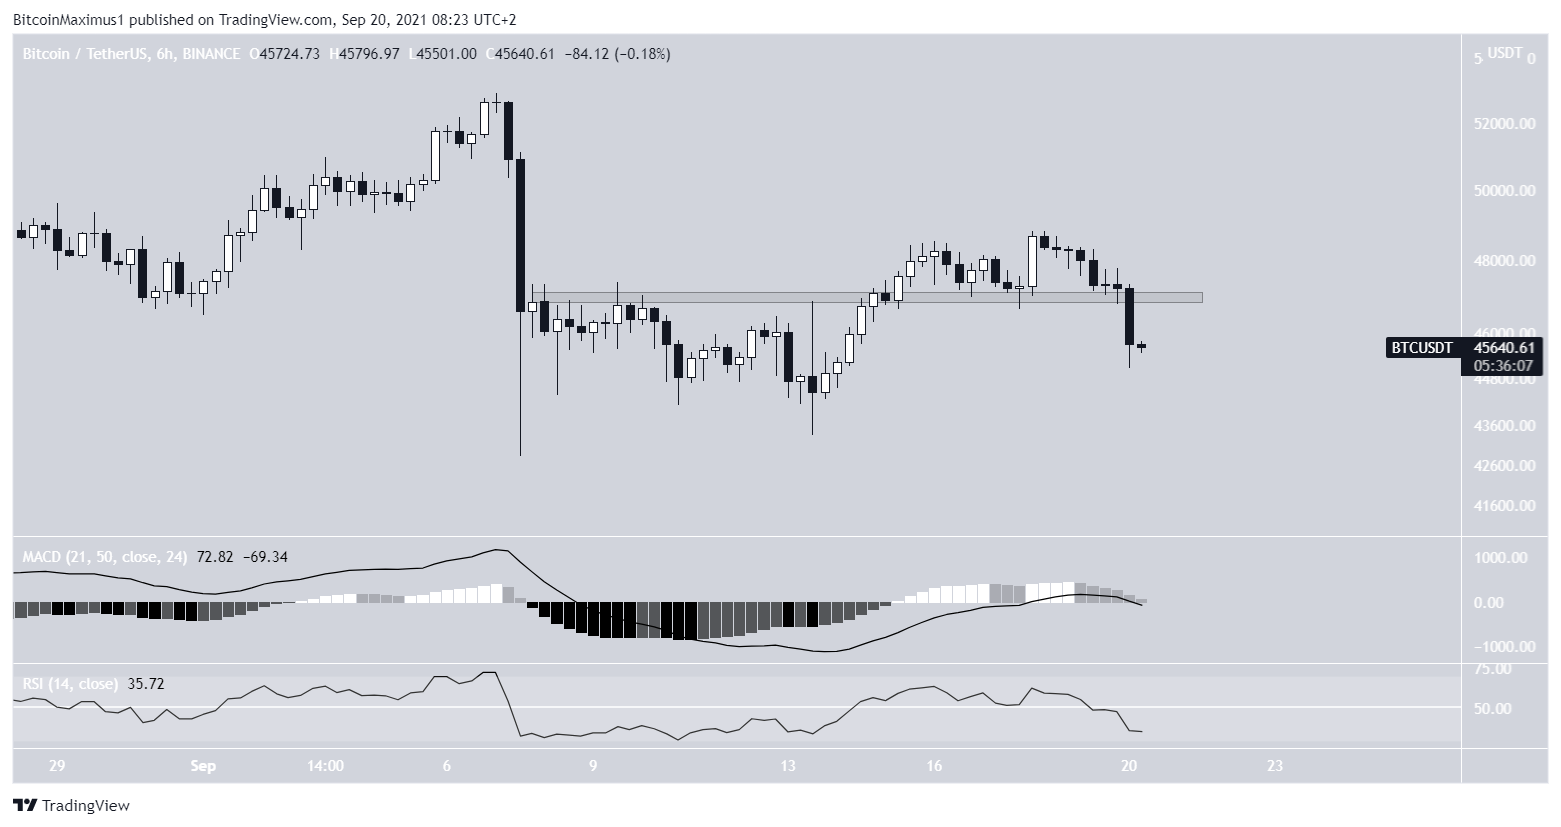
The six-hour chart shows that BTC has fallen below the minor $47,000 support area. It did so with a significant bearish candlestick, so it is a sign that the short-term trend has also turned bearish.
Also, the RSI and MACD are both bearish. The former has fallen below 50 while the latter is negative.
Wave count
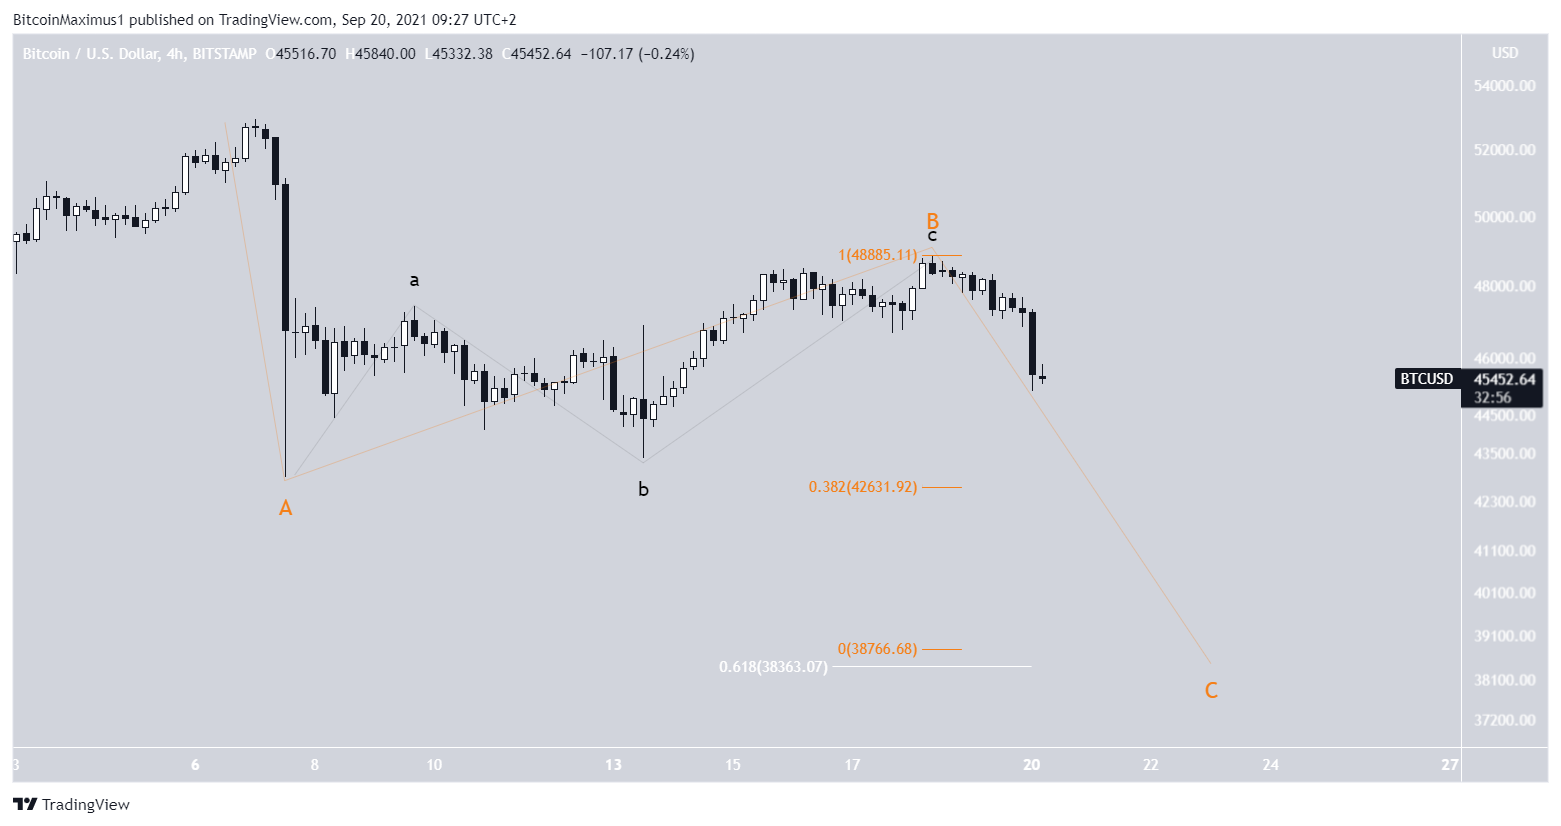
The short-term wave count shows that BTC has completed an A-B-C corrective structure (black).
It moved slightly above the 0.5 Fib retracement level (white) and the 1:1 length of waves A:C before falling sharply.

In the longer-term count, the previous structure completes a longer-term B wave (orange).
Therefore, the current decrease is a part of wave C.
The two most likely targets for the bottom of the movement are found at $42,630 and $38,350-$38,750. The latter range is the 0.618 Fib retracement support level (white) and gives waves A:C a 1:1 ratio. Therefore, it is more likely to act as the bottom.
For BeInCrypto’s previous Bitcoin (BTC) analysis, click here.
Trusted
Disclaimer
In line with the Trust Project guidelines, this price analysis article is for informational purposes only and should not be considered financial or investment advice. BeInCrypto is committed to accurate, unbiased reporting, but market conditions are subject to change without notice. Always conduct your own research and consult with a professional before making any financial decisions. Please note that our Terms and Conditions, Privacy Policy, and Disclaimers have been updated.
