

Bitcoin (BTC) is in the process of making its first breakout attempt above the $57,200 resistance area. If successful, it could test the highs reached back in April and May of this year.
A breakout could take BTC back to the $60,000 level and could potentially lead to a new all-time high price being achieved
Bitcoin attempts breaking above resistance
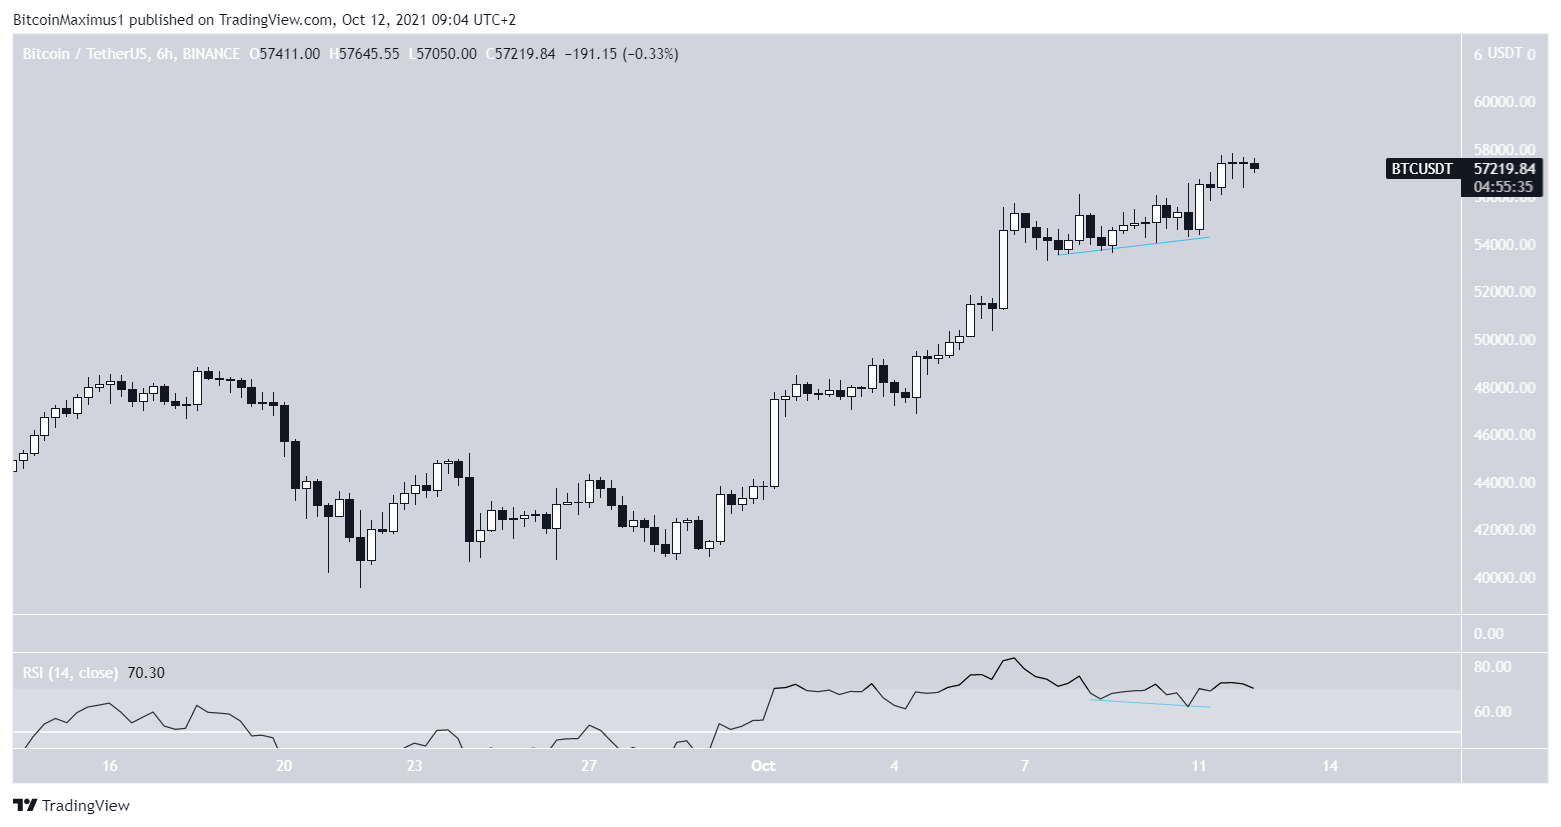
BTC increased considerably on Oct 11, creating a large bullish candlestick, which took it inside the $57,200 resistance. This is the 0.786 Fib retracement resistance level and is the final horizontal area prior to the all-time high price.
The fact that BTC managed to close well inside this resistance area is a bullish occurrence, since the upward movement was sustained due to sellers not being able to push the price down.
In addition to this, technical indicators in the daily time frame are firmly bullish.
Firstly, the RSI has moved above the 50-line. Crosses above and below this line are used as a basis for the direction of the trend. The previous cross above this line led to an almost two-month upward move.
Secondly, the MACD is positive and increasing. This indicator is created by using a combination of short and long-term moving averages (MA). The fact that it’s positive and increasing shows that the short-term trend is moving quicker than the long-term trend.
Thirdly, the Supertrend line is bullish (green icon). The Supertrend is an indicator that uses absolute high and low prices in order to determine the direction of the trend. If the BTC price is higher than the indicator line, the Supertrend is considered to be bullish. Since BTC just moved above the Supertrend resistance line (green circle), the indicator has turned bullish.

Wave count
The RSI has generated a hidden bullish divergence. This is seen as a strong sign of trend continuation. Unsurprisingly, BTC resumed its upward move immediately after the occurrence.
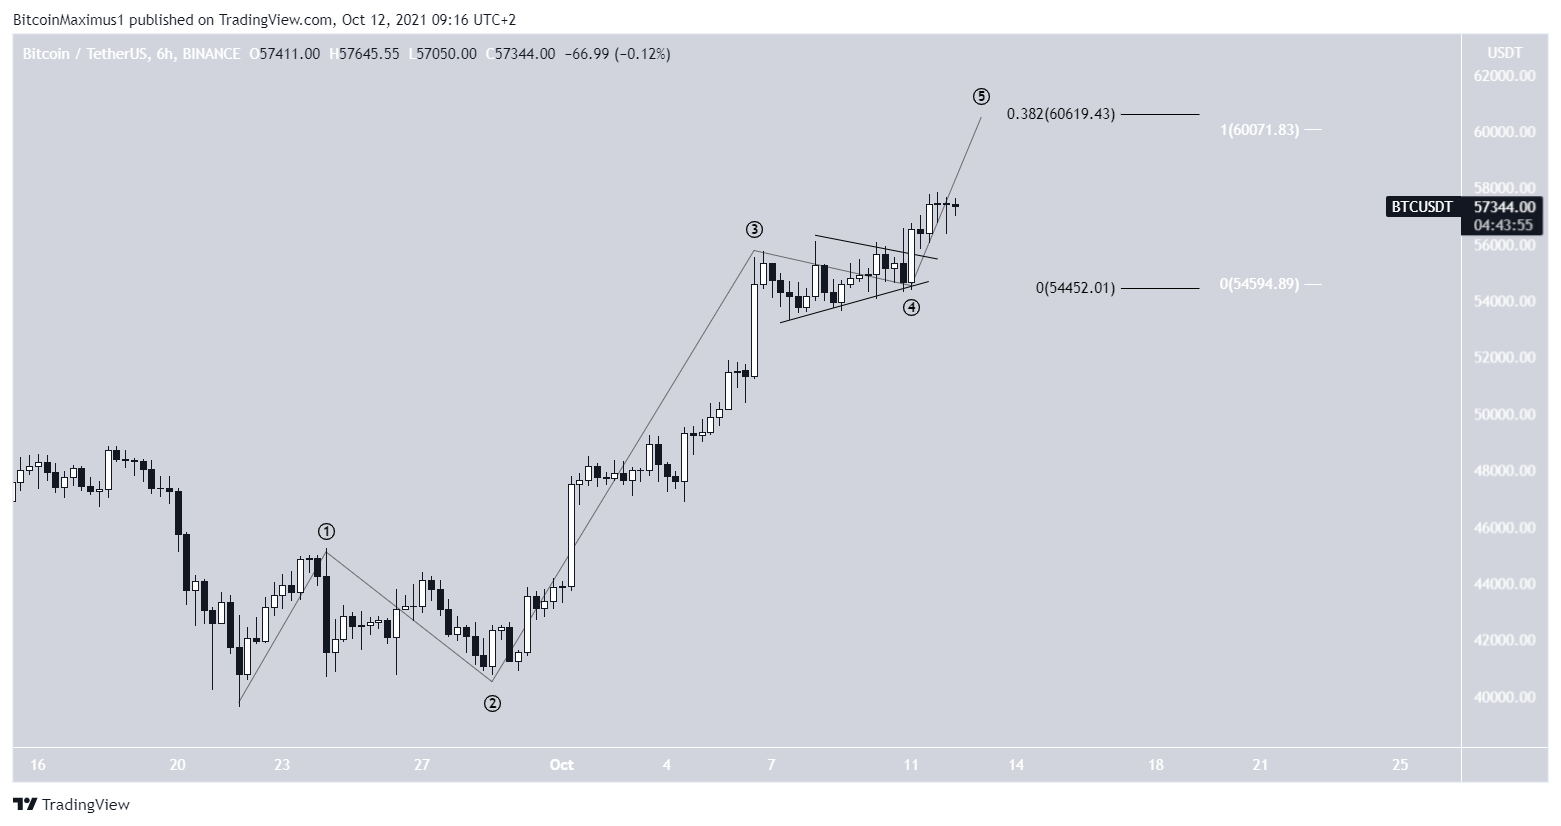
The wave count also supports the continuation of the upward trend. It shows that BTC is in the fifth and final wave of a bullish impulse. This means that while the trend is bullish, BTC is likely in the final portion of its increase.
Wave four had a triangular shape, which is most common for such waves, further solidifying the possibility that this is the correct count.
The most likely target for the top of the move is found between $60,000-$60,600. This target range is found using the 0.382 Fib length of waves 1-3 (black) and the 1:1 length of wave one (white).
For BeInCrypto’s previous Bitcoin (BTC) analysis, click here.
Trusted
Disclaimer
In line with the Trust Project guidelines, this price analysis article is for informational purposes only and should not be considered financial or investment advice. BeInCrypto is committed to accurate, unbiased reporting, but market conditions are subject to change without notice. Always conduct your own research and consult with a professional before making any financial decisions. Please note that our Terms and Conditions, Privacy Policy, and Disclaimers have been updated.
