

Bitcoin (BTC) is attempting to break out from a short-term descending resistance line. Doing so would confirm that the correction is complete.
BTC has been increasing since Nov 28, when it bounced at the $53,350 horizontal support area. The area is also the 0.5 Fib retracement support level (white), increasing its significance. The bounce confirmed that the level is acting as support.
Technical indicators are also providing bullish signs. This is especially visible in the MACD.
The MACD is an indicator that is created by short and long-term moving average (MA). It’s currently positive, meaning that the short-term MA is faster than the long-term average. More importantly, its histogram has created successive higher momentum bars for the first time since Oct 2. This preceded a 57% upward move that transpired over 40 days.
Therefore, it’s possible that a similar increase will follow this time around.

Short-term movement
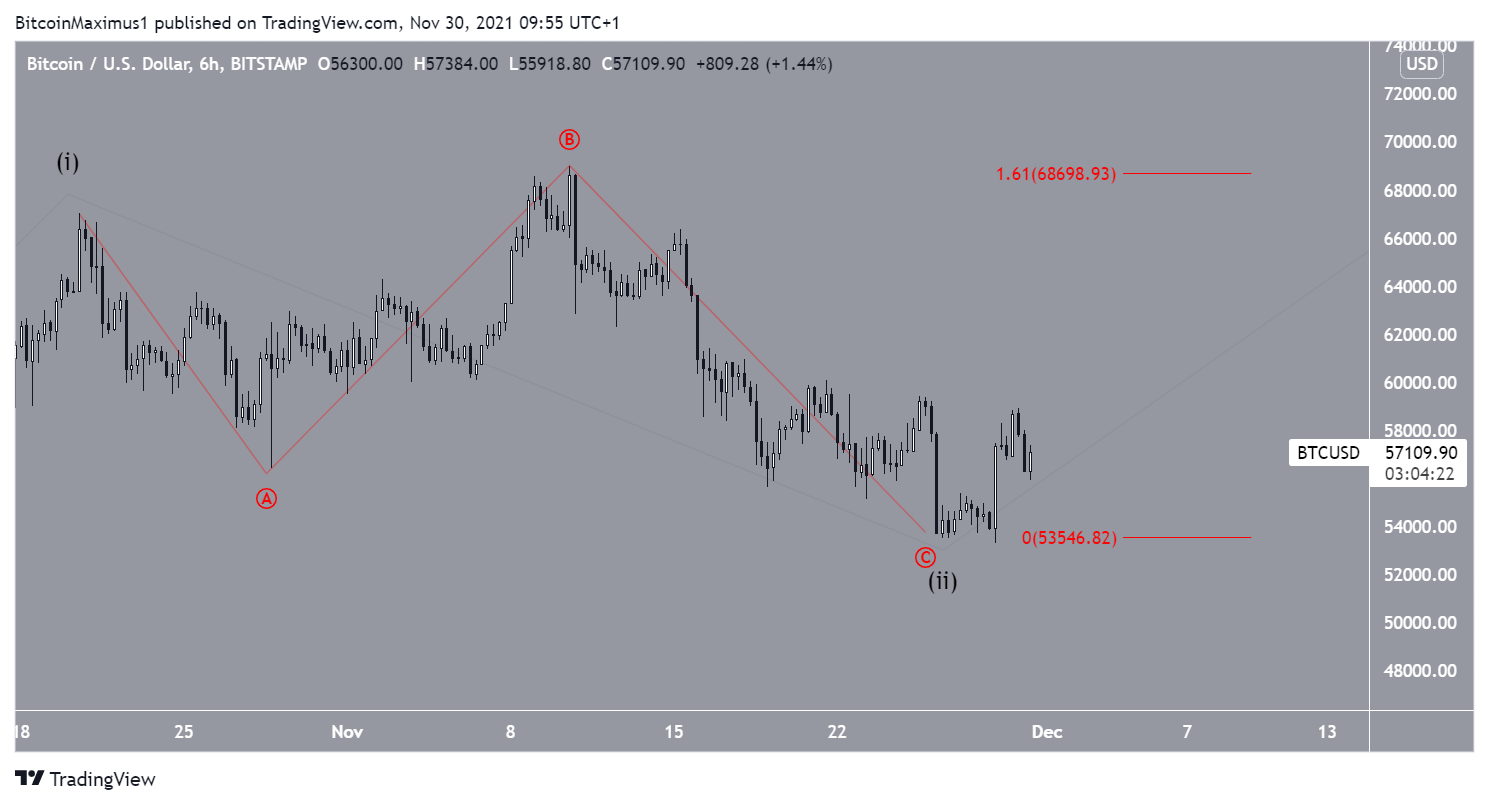
The six-hour chart shows that BTC is still following a descending resistance line since reaching an all-time high price on Nov 10.
The line also coincides with the $59,350 resistance area, which is the 0.382 Fib retracement resistance level. Until that resistance is broken, the correction cannot be considered complete.

BTC wave count
The short-term wave count suggests that BTC has completed an A-B-C corrective structure (red). The correction was complete right at the 1:1.61 ratio of waves A:C, which is common in such structures.
Therefore, an upward move would be expected to follow if the correction is considered complete.
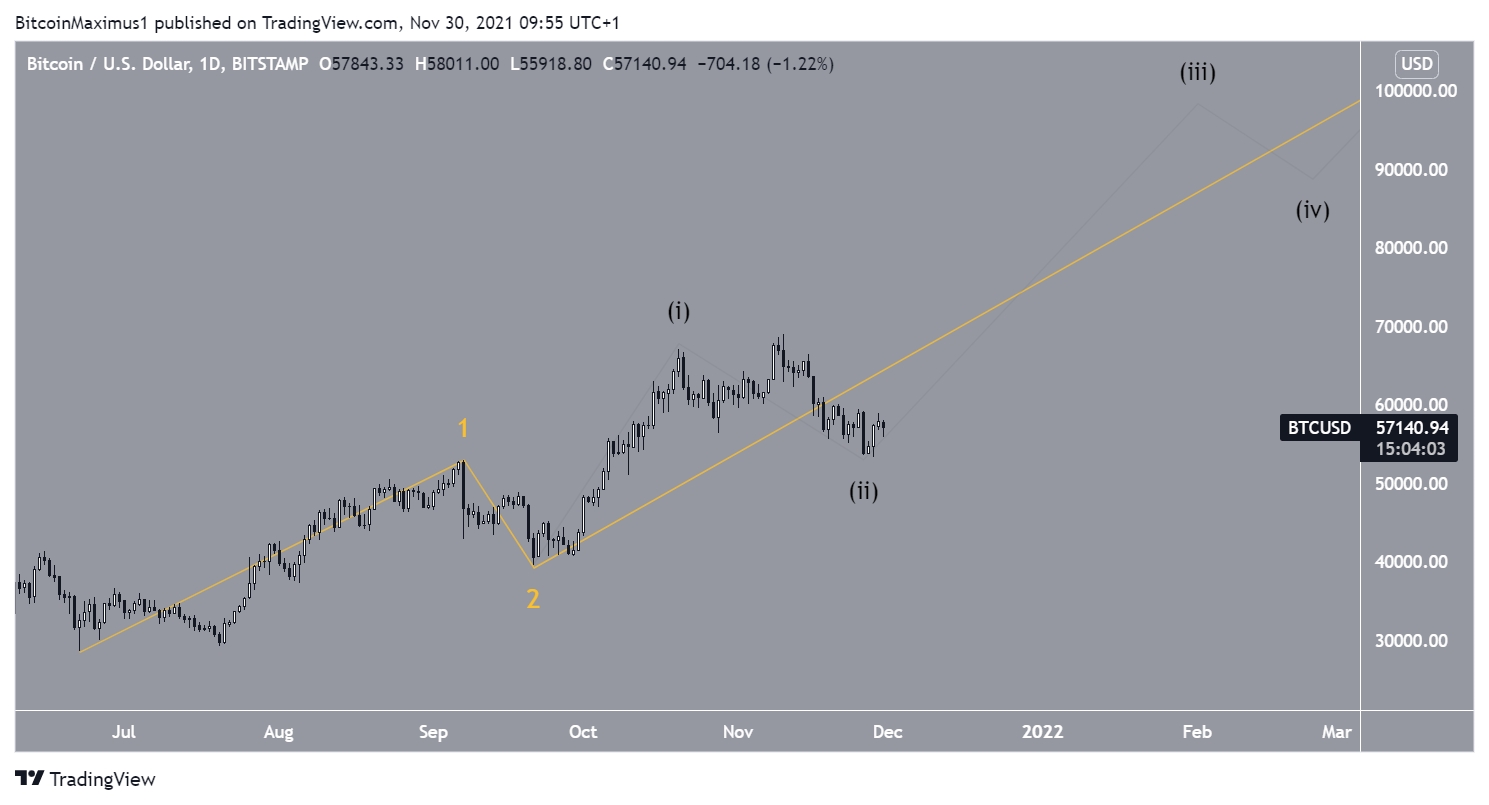
In the long-term, the most likely count suggests that the movement is part of a large 1-2/1-2 wave formation. In this case, BTC is currently beginning sub-wave three (black) of wave three (yellow), which is often the sharpest. Therefore, an acceleration of the upward move could soon follow.
Fo r BeInCrypto’s previous Bitcoin (BTC) analysis, click here.
Trusted
Disclaimer
In line with the Trust Project guidelines, this price analysis article is for informational purposes only and should not be considered financial or investment advice. BeInCrypto is committed to accurate, unbiased reporting, but market conditions are subject to change without notice. Always conduct your own research and consult with a professional before making any financial decisions. Please note that our Terms and Conditions, Privacy Policy, and Disclaimers have been updated.
