

Monero (XMR) failed to sustain its March 8 upward movement and is now trading below a long-term horizontal resistance level.
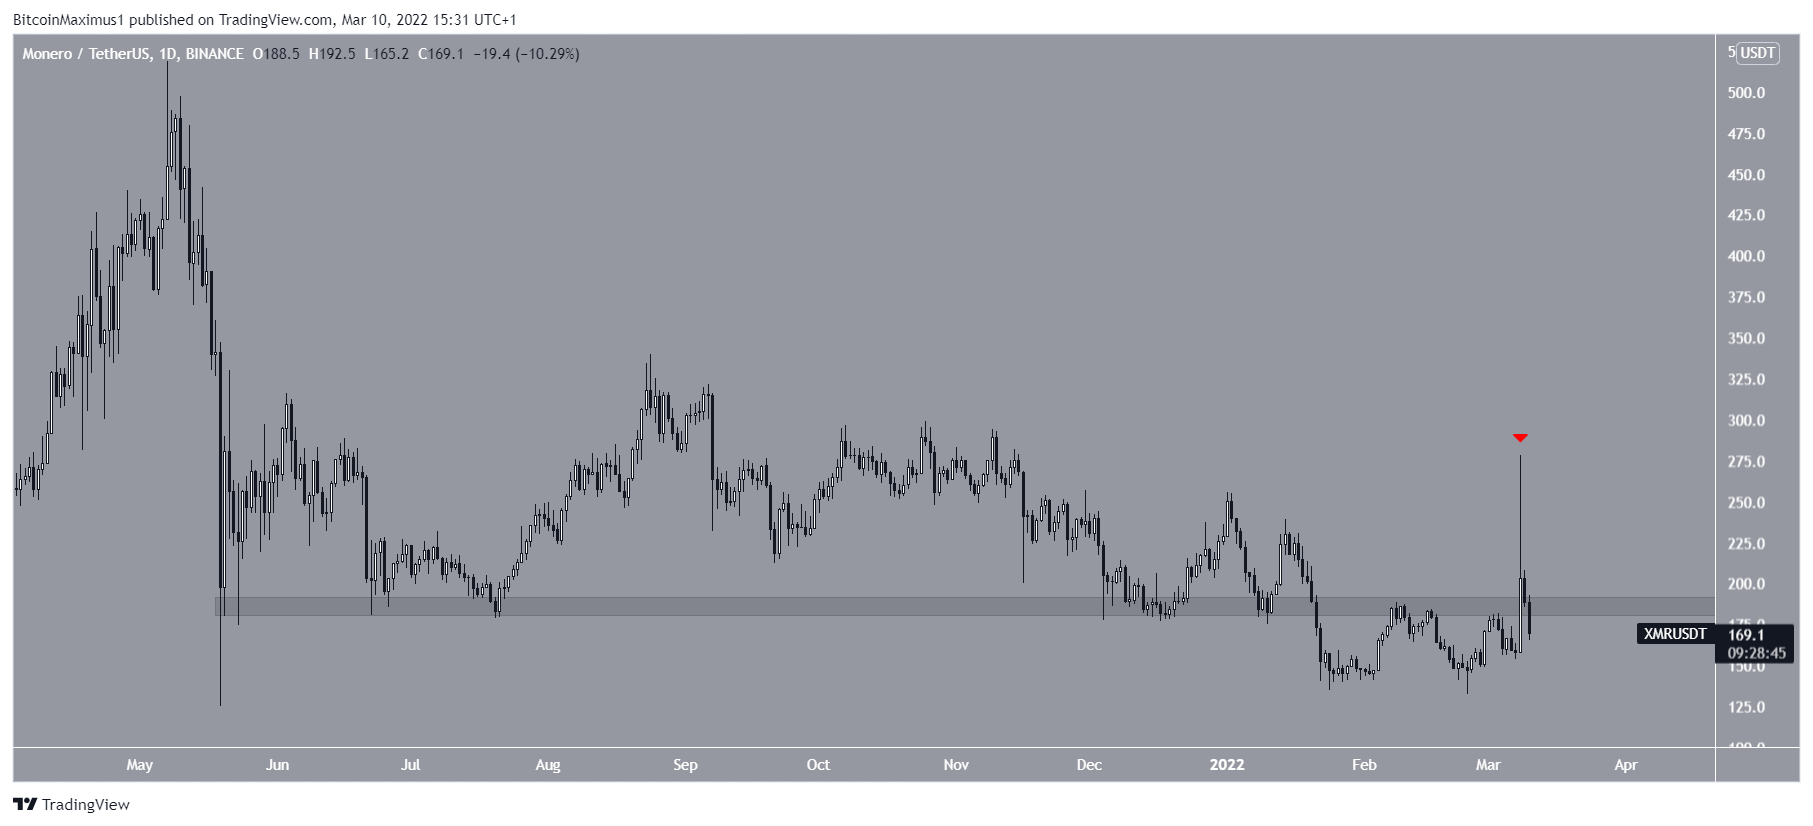
XMR has been falling since reaching a high of $519 on May 7. The downward movement led to a low of $124 on May 19.
However, the price bounced afterwards and validated the $185 area as support. On March 8, XMR initiated a strong upward movement that led to a high of $278. This amounted to an increase of 76%.
However, the upward movement could not be contained and XMR created a long upper wick (red icon), which is considered a sign of selling pressure. On March 10, the price completely retraced the previous increase.
More importantly, XMR fell below the $185 horizontal area, which is now expected to act as resistance once more.
Potential XMR reversal
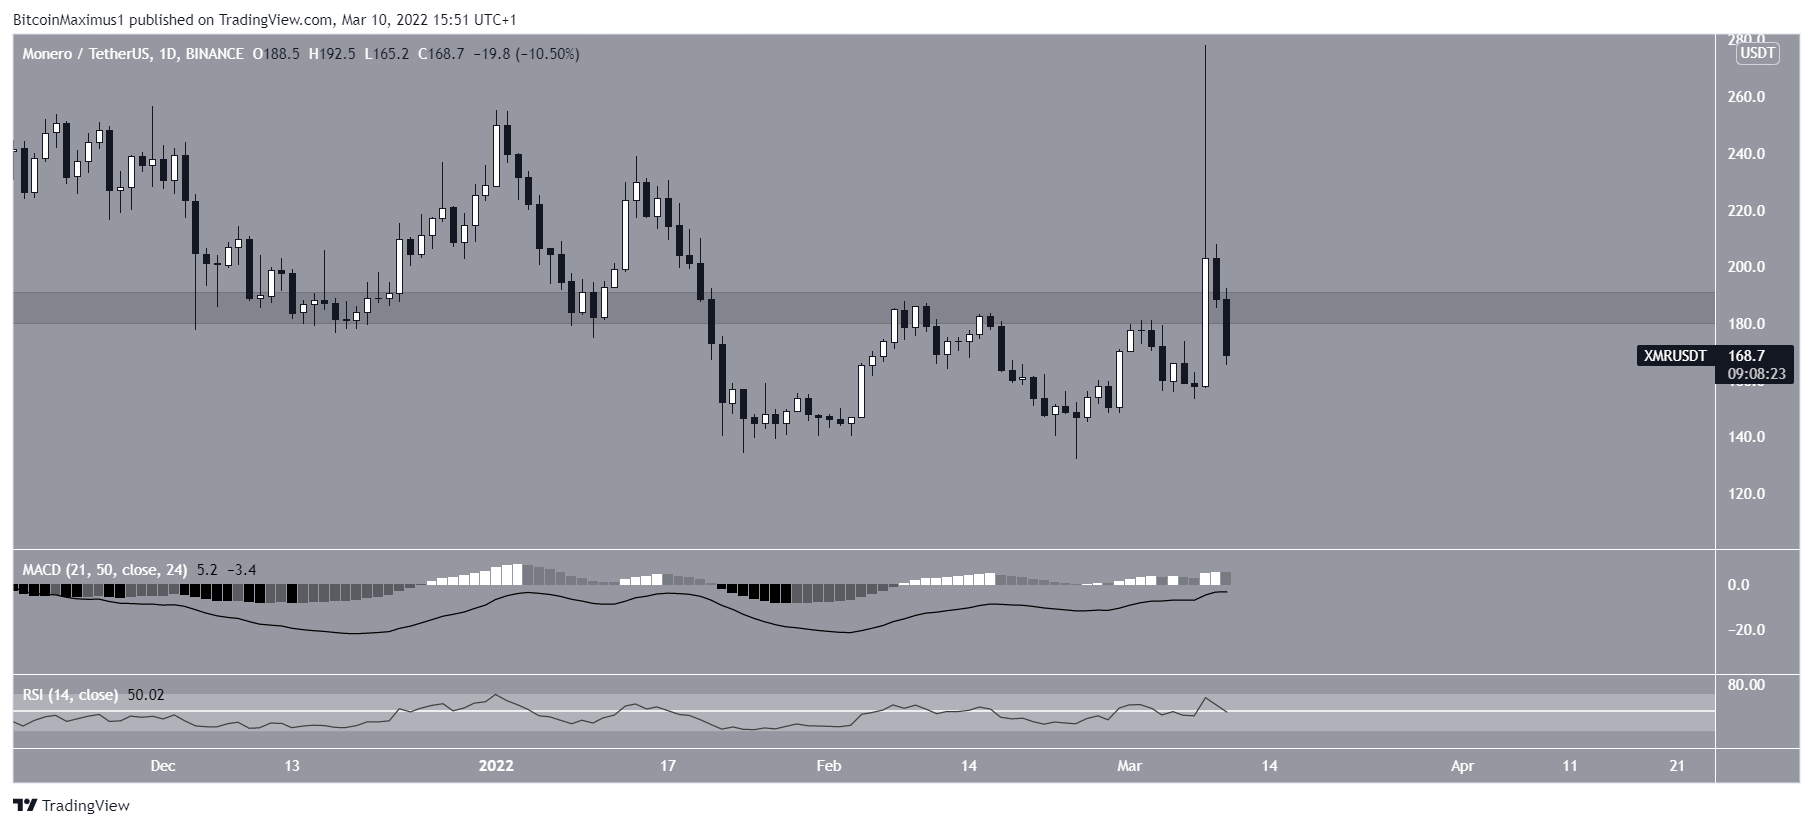
Technical indicators in the daily time-frame are showing some bullish signs, but have yet to confirm the bullish reversal.
While both the MACD and RSI are moving upwards, neither has crossed their bullish thresholds. In the case of the MACD, this would mean an increase above 0, while in the case of the RSI, an increase above 50 would be required.
This is in line with the XMR relationship with the $185 resistance area, since a breakout above it would likely cause technical indicators to turn bullish.
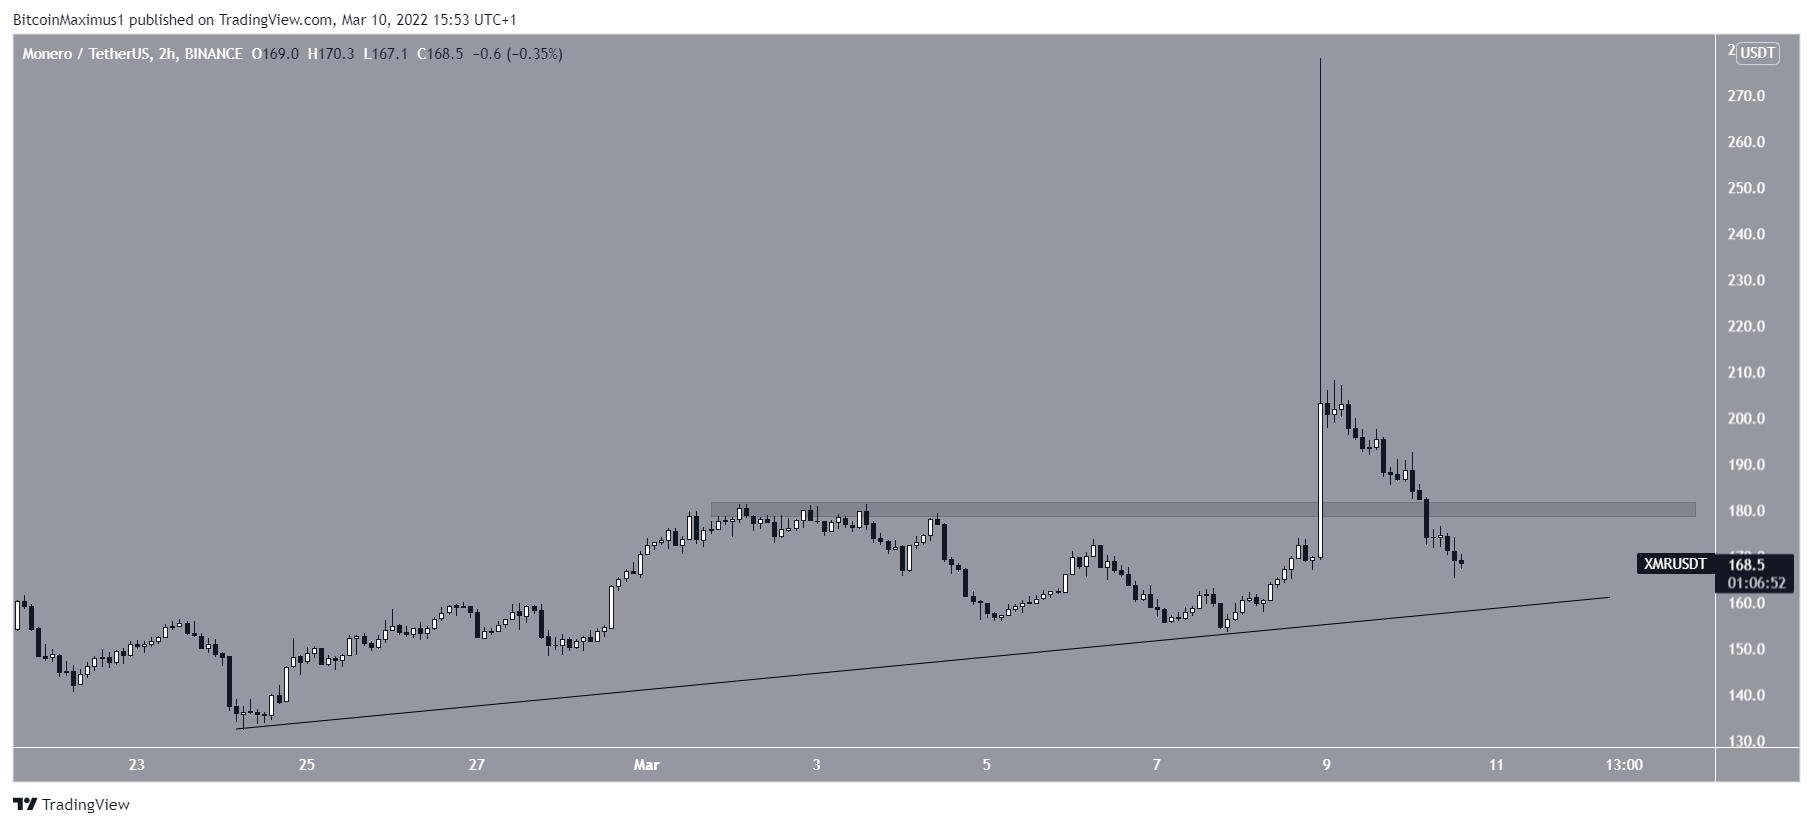
In addition to this, the two-hour chart fails to provide any clarity as to the direction of the trend.
While XMR has been following an ascending support lien since Feb 24, it failed to validate the minor $180 level as support. After breaking out, the price fell below it. The $180 area is now expected to provide resistance.
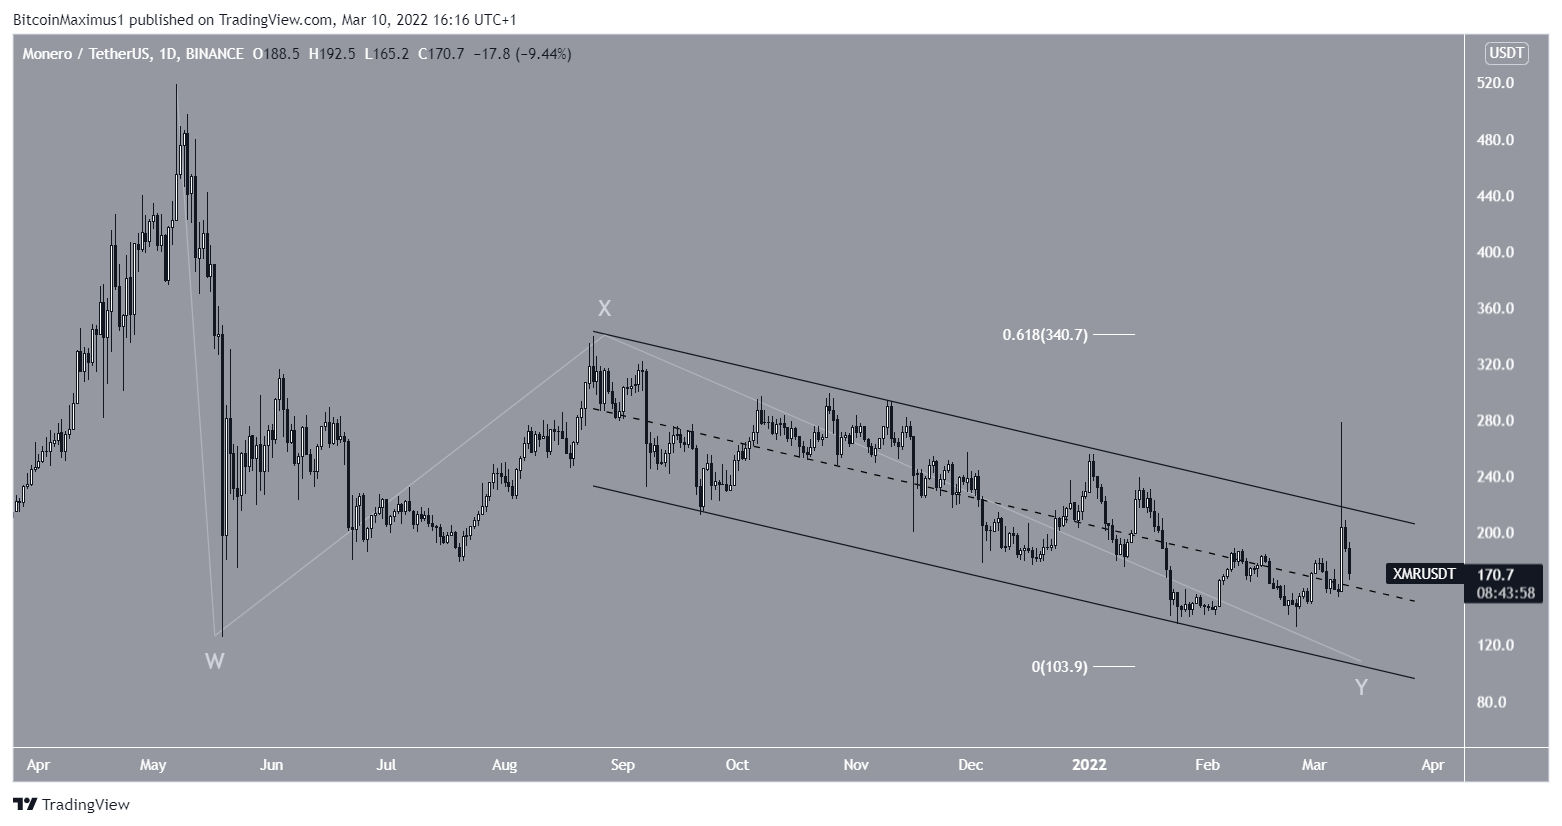
Wave count analysis
Cryptocurrency trader @ewfib tweeted a chart of XMR, stating that the correction could end close to $110.
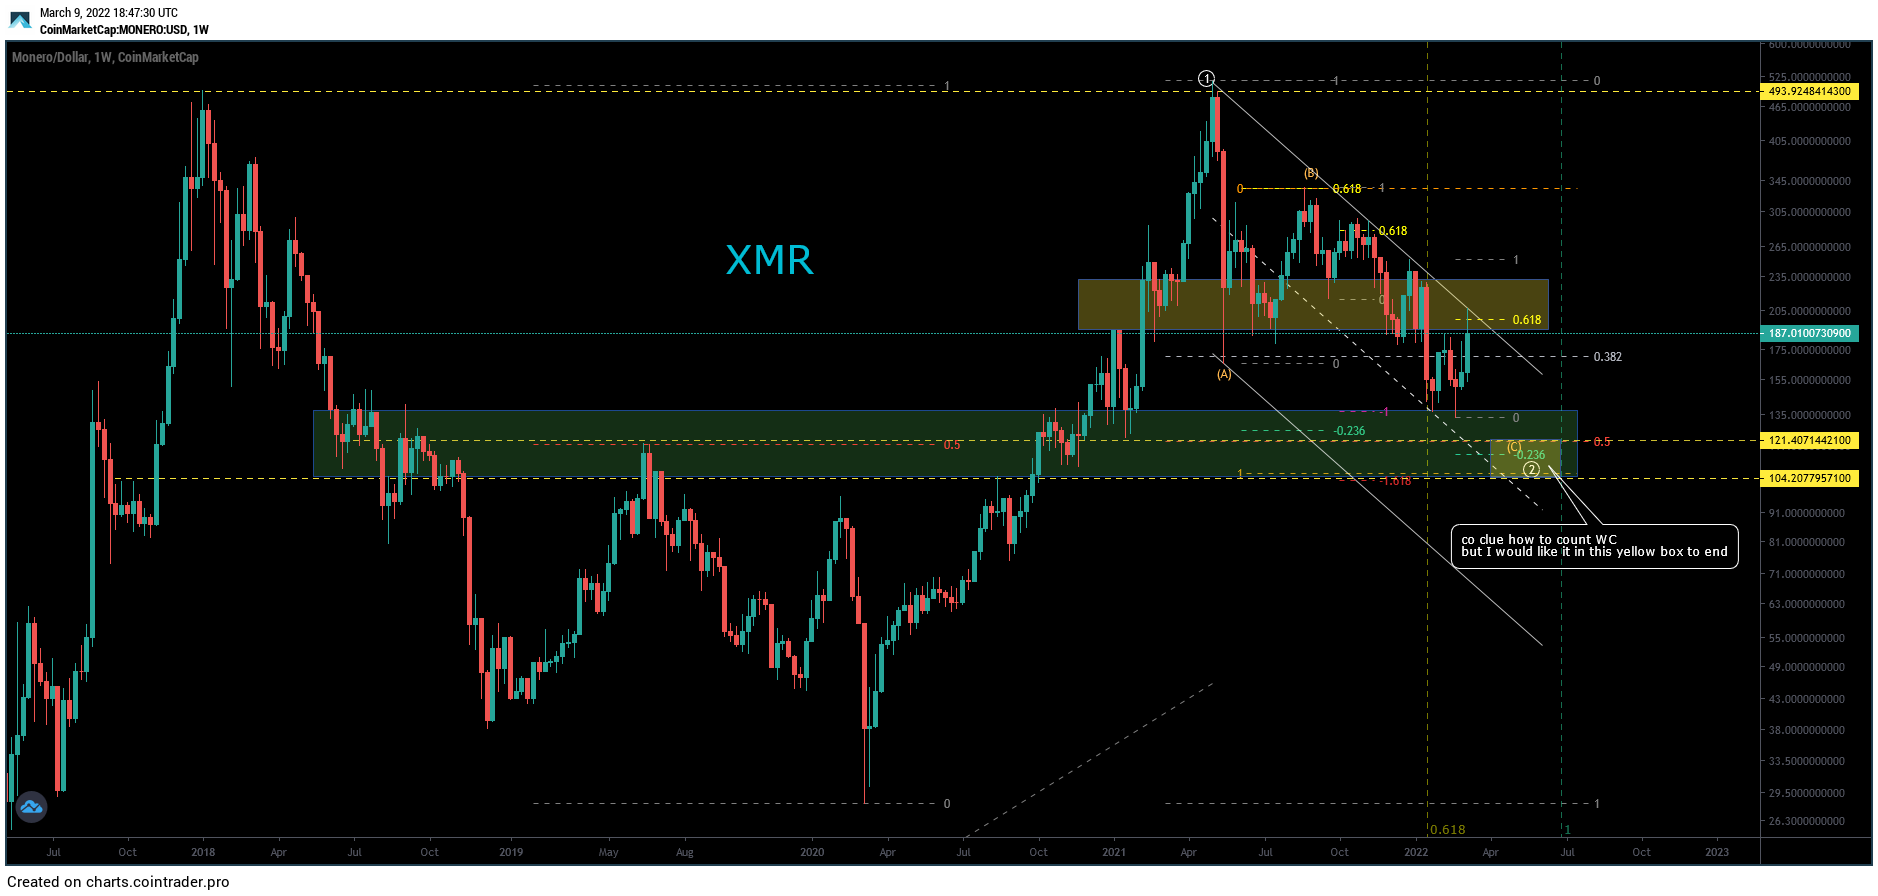
The most likely wave count does suggest that XMR is in some sort of a corrective structure. This is especially visible by the fact that the movement since Aug 24 is contained inside a descending parallel channel. Furthermore, there is considerable overlap inside the pattern.
Giving waves W:Y (white) a 1:0.618 ratio would lead to a low of $104. This would also validate the support line of the channel once more.
BeInCrypto’s latest Bitcoin (BTC) analysis, click here
Trusted
Disclaimer
In line with the Trust Project guidelines, this price analysis article is for informational purposes only and should not be considered financial or investment advice. BeInCrypto is committed to accurate, unbiased reporting, but market conditions are subject to change without notice. Always conduct your own research and consult with a professional before making any financial decisions. Please note that our Terms and Conditions, Privacy Policy, and Disclaimers have been updated.
